Mission Control
The local dashboard for inspecting runs, approving gates, reading diffs, and steering the orchestrator.
In simple words
Mission Control is Vibestrate’s dashboard and the primary way to use it, served on demand by a local process on 127.0.0.1:4317.
vibe uiThere is no backend of ours behind it.
Local only A process on your machine, bound to loopback. Nothing is sent anywhere.
On demand Not a daemon. Close it and runs carry on without it.
The same data as the CLI One project directory, read by both. Neither is a copy of the other.
It is served on demand, not a daemon you leave running. Close it and nothing stops - runs continue, and reopening shows you where they got to.
What it reaches the network for, and nothing else: the Flows Hub when you search, pull or publish a flow; fetching a skill from a URL; importing a flow from a URL. It never pushes, never merges without a confirmation you send with the request, and never runs a shell command you type.
The dashboard writes config through the same gated writer the CLI uses, so a project policy denying file writes stops the editor too. The UI is not a privileged path around your rules.
Start it
vibe ui               # 127.0.0.1:4317, opens your browser
vibe ui --port 4400   # a different port
vibe ui --no-open     # headless
--host with anything other than 127.0.0.1 exposes the API on your network and requires VIBESTRATE_API_TOKEN to be set.
Start a run with the dashboard already attached:
vibe run "Add audit logging" --uivibe ui in a folder with no .vibestrate/ opens an onboarding screen rather than a half-broken dashboard: it scaffolds the project, creating the git repository first if you ask. It ends on Enter Vibestrate, or Finish setting up when no usable provider was detected, which lands you on Setup.
On the first visit a guided tour points out the six surfaces the rest of the app hangs off: Runs, Flows, Board, Policies, the Consult orb, New run. Skip it, or take it again from the help overlay (press ?).
The sidebar
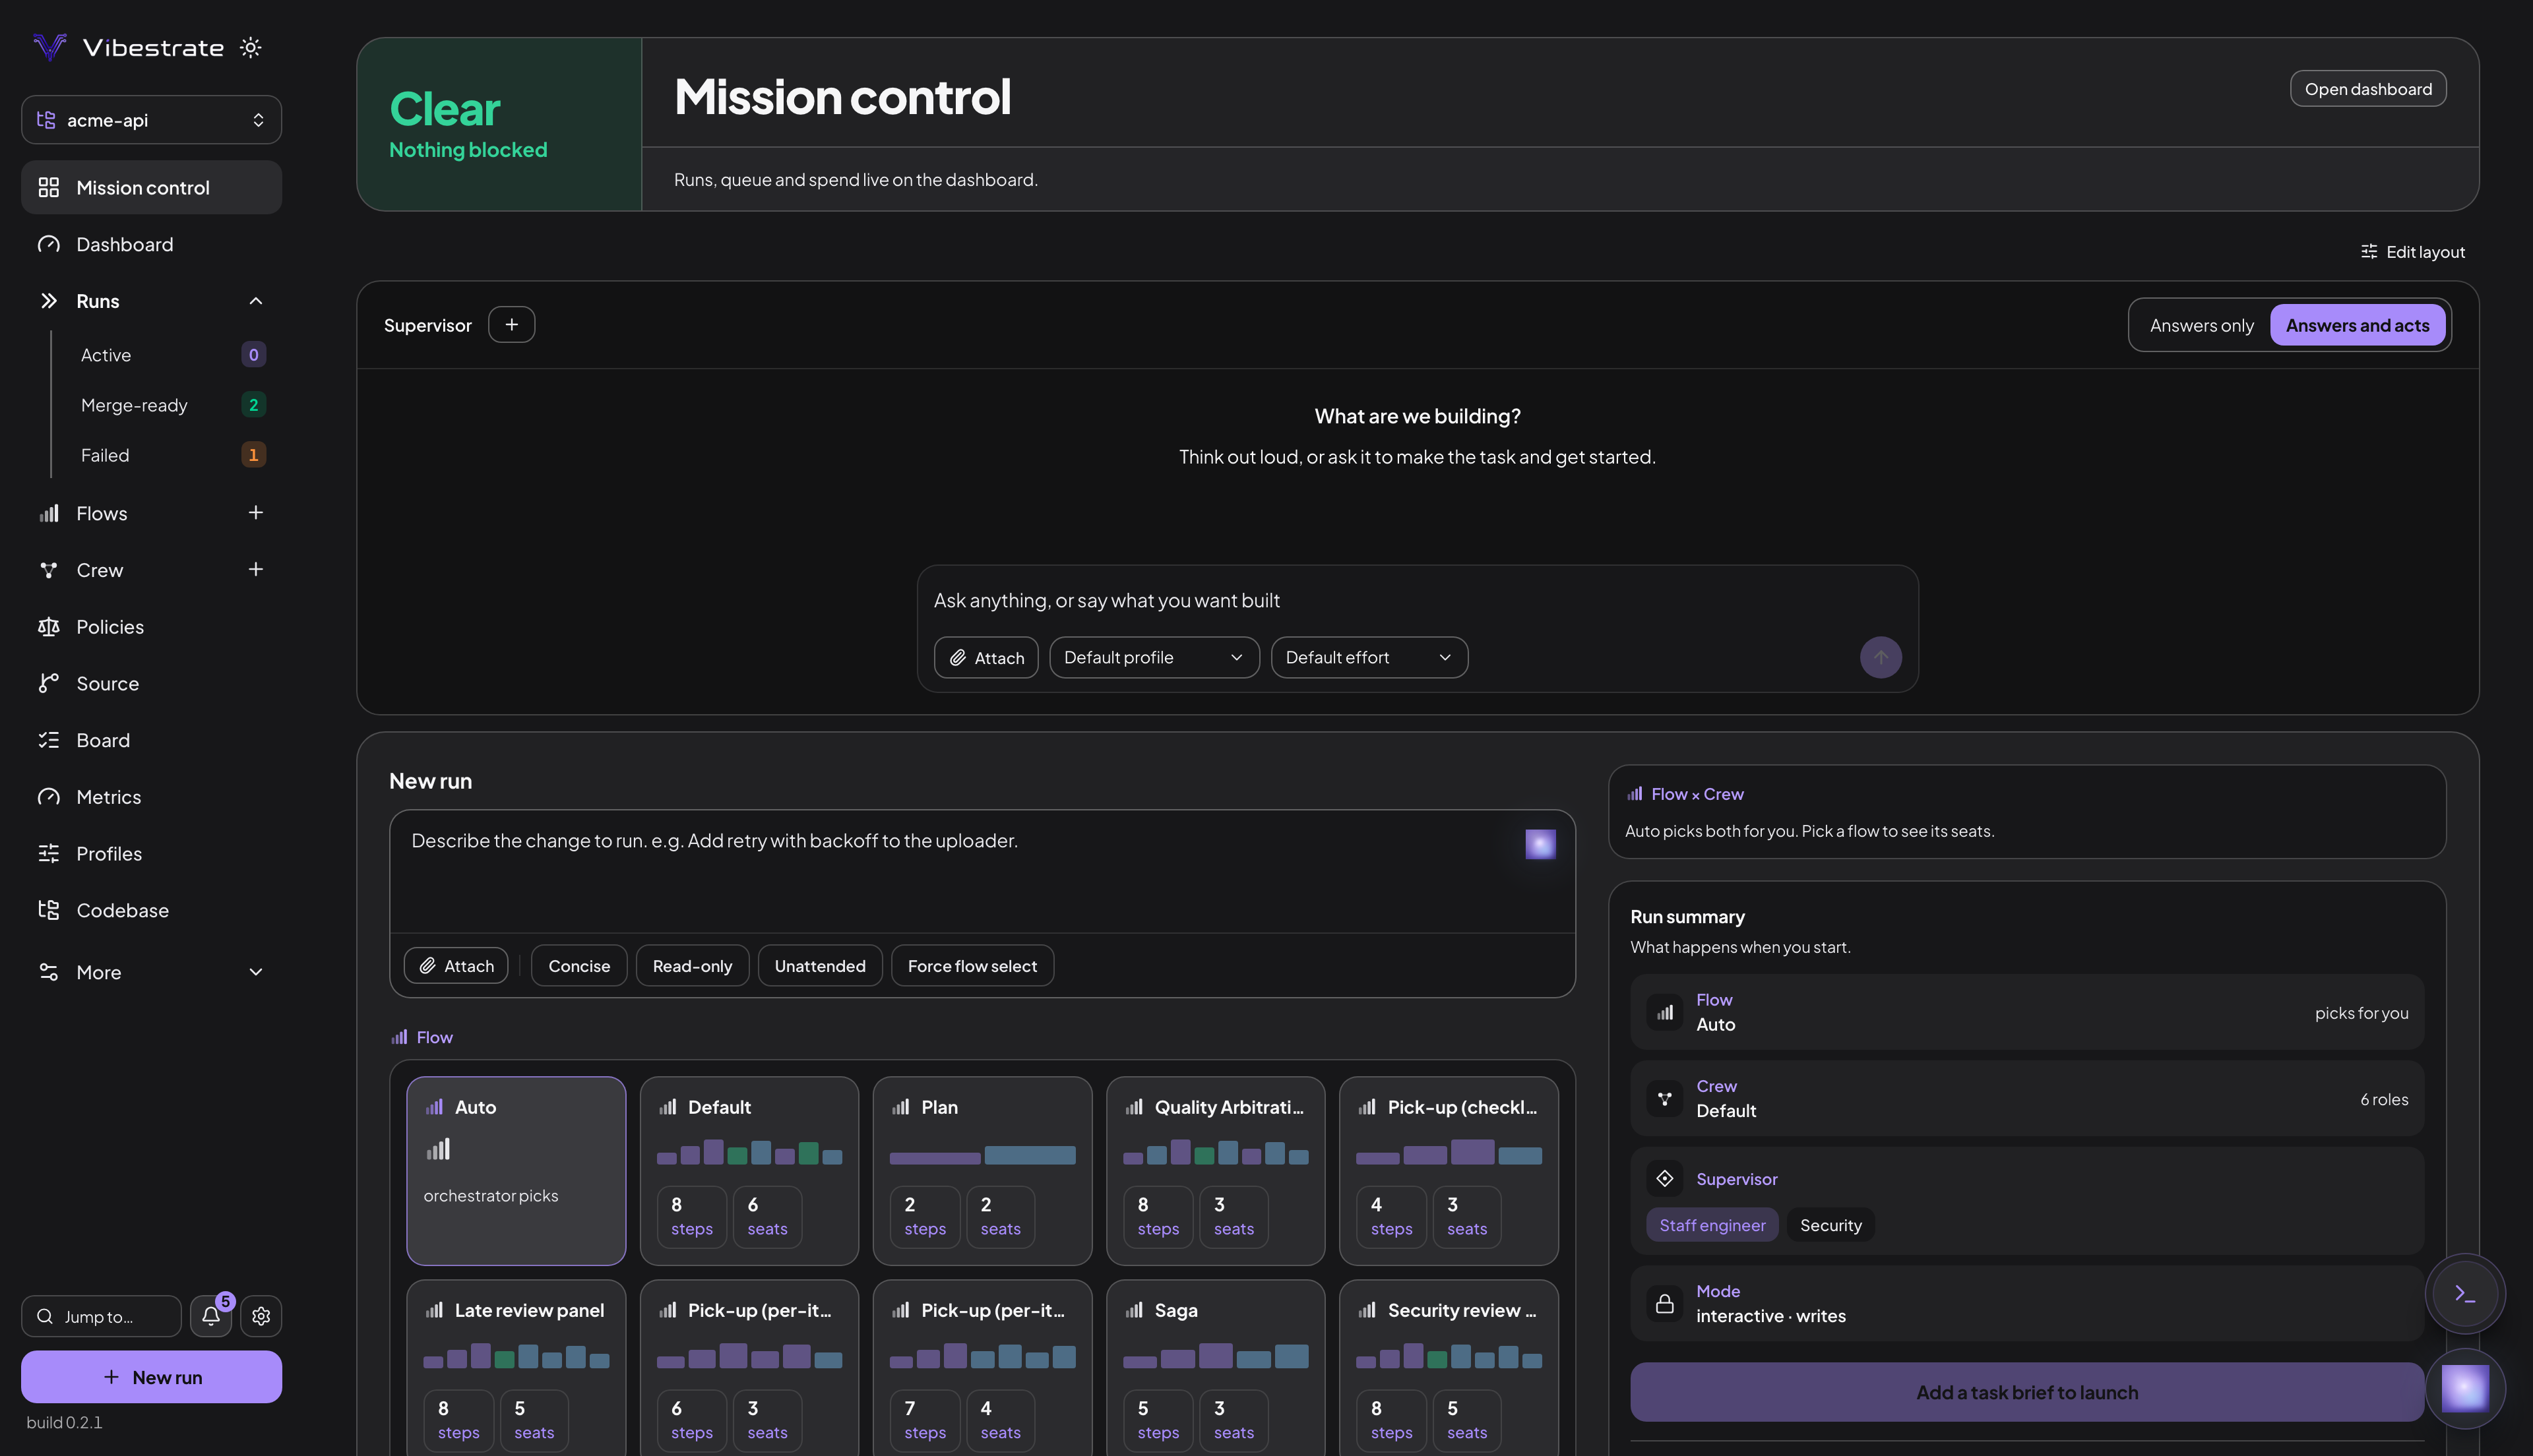
The left sidebar is the app shell; the page you open fills the window. A live run gets a card pinned above the nav, green while it works and amber when it is waiting on you.
Below those cards, in order:
- Mission control - the home screen: how many runs are waiting on you, a draggable board carrying the Supervisor and New run panels, and a Waiting on you section that approves or rejects each blocked run in place.
- Dashboard - the run-shaped overview: Active runs, Merge-ready and Runs this week counts over an active-run list and a recent-run list, rearrangeable from Dashboard layout.
- Runs - every recorded run, with Active, Merge-ready and Failed sub-rows carrying live counts. The scheduler queue sits on top; the page carries Preview merges, Integrate selected, Complete merge to main and Prune snapshots.
- Flows - the Flows Vibestrate found, built-in and project. Fork a builtin to change it; the
+on the row opens a new flow in the editor. - Crew - two tabs. Crews is your roles, the seats each fills and the profile each runs on. Providers is the local CLIs Vibestrate drives: installed, configured, a test for each. One provider can power many roles.
- Policies - your own rules, plus the safety gates in three groups: Hard guards, Execution and Supervisor posture, each a switch you can change here. The four hard guards are on by default; execution and posture are opt-in.
- Source - the single git surface: Changes, an inline diff viewer over the working tree and each run’s worktree; Tree, the commit graph with a merge planner (see Merge from the git tree); Merge, every merge-ready run with its check lanes, branch drift and deterministic advice.
- Board - the task kanban, with a Ledger tab holding what shipped, what is open, and the decisions on record. An entry you add yourself is tagged as added by hand, so a later run never reads your note as something it did.
- Metrics - totals across every run and every model.
- Profiles - the provider, model and effort a role runs on, saved once and pointed at by as many roles as you like.
- Codebase - your repo as Vibestrate sees it, over the project root or any run’s worktree. Four modes: Files filters by name, Content searches contents with glob, regex and case controls, Ask puts a question to the supervisor, Map renders the codebase map.
Under More, in order: Supervisors, Proposals, Setup, Project, Config, All projects.
- Supervisors - how hard each supervisor persona checks a run, and which is this project’s default. Mirrors
vibe supervisor list. - Proposals - drafts waiting on a review before they become roadmap items, plus a box that plans a roadmap for a broad goal.
- Setup - see below.
- Project - high-level project state.
- Config -
project.yml, grouped and editable. Mirrorsvibe config view. - All projects - runs, outcomes and spend across every registered project.
Under the nav sit Jump to… (Cmd/Ctrl-K), the notification bell, Settings, the New run button, and the build number of the server answering the page.
Setup
Setup is the guided path from an empty folder to a first run, rendering the same report vibe doctor prints - not a second opinion. Every step reads doctor’s own findings, so a check added there appears here without being re-implemented.
Five numbered steps, in the order the work has to happen:
- A repository to work in
- Initialise the project
- Connect a model
- Point it at your tests
- Everything else doctor checks
Then a sixth, Start your first run, whose button stays disabled while any failure is outstanding.
Fix what’s safe runs the same narrow repair pass as vibe doctor --fix, and appears only when something is repairable. Re-check re-runs the report.
Jumping between runs
Cmd/Ctrl-K (or g r) opens the run switcher anywhere: a search box over recent runs, filterable by task, runId or status. Every run is directly linkable at #/runs/<runId>.
Watching a run
Open a run to supervise it live.
- Status hero - the task, a phase rail that follows the actual steps of this run’s flow rather than a fixed workflow, and a live “Now ⟨step⟩ · ⟨agent⟩” line.
- Approval banner - a run blocked on you is decided here, at the top of the run, not on a separate page.
- Live timeline - one row per step, with the role and profile in the seat, elapsed time and a live tail. Expand a row for the prompt it received, its transcript and its response.
- Live metrics - tokens, cost, tool calls and provider calls, accumulating as steps finish.
- Changed files - what the run touched. Click one to open it in the worktree view.
- Live execution - the raw provider output. Agents run headless (
claude -p, and equivalents), and CLIs in print mode hold their answer until they exit, so this fills in per step, not token-by-token. - Workspace - the run’s worktree path and branch, with a copyable
cd. - Inspector tabs - Tree, Steps, Events, Artifacts, Validation, Terminal, Replay.
?tab=deep-links into one. Six ids resolve to a tab -artifact,diff,validation,events,terminalandreplay- anddifflands on Artifacts, which absorbed the standalone diff view. The URL accepts the wider set of ids the pre-v3 inspector used, but any of those,treeandartifactsincluded, lands on Steps rather than erroring. - Outcome banner - a run ending
blocked,failedorabortedgets a line saying what stopped it and the next action.
What the dashboard does not do
- It does not execute arbitrary shell commands you type. The integrated terminal is off unless you turn it on for the project, its working directory comes from the run’s recorded worktree rather than the request, and a run with no worktree, or one pointing at your project root, is refused. Native Windows has no integrated terminal - it needs a POSIX shell, so use WSL.
- It never pushes. There is no push path in the dashboard.
- It never merges on its own. Source applies only the exact merge you asked for: the request must carry a literal
merge-to-mainconfirmation and is refused without it. Undo is the same shape, with its ownundo-mergeconfirmation. - It does not read your
.envor any secret-shaped file. The path guard refuses those paths whatever the request.
Stopping it
Press Ctrl-C in the terminal running vibe ui. The server exits cleanly; runs continue, or pause at the next stage boundary, depending on what they are doing.
